
When you make the decision to buy or sell a home, I'm committed to going the extra mile to ensure that all of your needs are met in a professional and honest manner. For Service and Commitment, let me help guide you with your next purchase or sale.

Home sellers were more active in Metro Vancouver’s* housing market in September while home buyer demand remained below the region’s long-term averages.
The Real Estate Board of Greater Vancouver (REBGV) reports that residential home sales in the region totalled 1,687 in September 2022, a 46.4 per cent decrease from the 3,149 sales recorded in September 2021, and a 9.8 per cent decrease from the 1,870 homes sold in August 2022.
Last month’s sales were 35.7 per cent below the 10-year September sales average.
"With the Bank of Canada and other central banks around the globe hiking rates in an effort to stamp out inflation, the cost to borrow funds has risen substantially over a short period. This has resulted in a more challenging environment for borrowers looking to purchase a home, and home sales across the region have dropped accordingly."Andrew Lis, REBGV director, economics and data analytics
There were 4,229 detached, attached and apartment properties newly listed for sale on the Multiple Listing Service® (MLS®) in Metro Vancouver in September 2022. This represents an 18.2 per cent decrease compared to the 5,171 homes listed in September 2021 and a 27.1 per cent increase compared to August 2022 when 3,328 homes were listed.
The total number of homes currently listed for sale on the MLS® system in Metro Vancouver is 9,971, an eight per cent increase compared to September 2021 (9,236) and a 3.2 per cent increase compared to August 2022 (9,662).
“With fewer homes selling and new listings continuing to come to market, inventory is beginning to accumulate, providing buyers with more selection compared to last year,” Lis said. “With more supply and less demand within this market cycle, residential home prices have edged down in the region over the last six months.”
For all property types, the sales-to-active listings ratio for September 2022 is 16.9 per cent. By property type, the ratio is 12.4 per cent for detached homes, 18.4 per cent for townhomes, and 20.9 per cent for apartments.

Generally, analysts say downward pressure on home prices occurs when the ratio dips below 12 per cent for a sustained period, while home prices often experience upward pressure when it surpasses 20 per cent over several months.
The MLS® Home Price Index composite benchmark price for all residential properties in Metro Vancouver is currently $1,155,300. This represents a 3.9 per cent increase over September 2021, an 8.5 per cent decline over the past six months, and a 2.1 per cent decline compared to August 2022.
Sales of detached homes in September 2022 reached 525, a 44.7 per cent decrease from the 950 detached sales recorded in September 2021. The benchmark price for a detached home is $1,906,400. This represents a 3.8 per cent increase from September 2021 and a 2.4 per cent decrease compared to August 2022.
Sales of apartment homes reached 888 in September 2022, a 45.2 per cent decrease compared to the 1,621 sales in September 2021. The benchmark price of an apartment home is $728,500. This represents a 6.2% per cent increase from September 2021 and a 1.6 per cent decrease compared to August 2022.
Attached home sales in September 2022 totalled 274, a 52.6 per cent decrease compared to the 578 sales in September 2021. The benchmark price of an attached home is $1,048,900. This represents a 9.1 per cent increase from September 2021 and a 1.9 per cent decrease compared to August 2022.
* Areas covered by the Real Estate Board of Greater Vancouver include: Burnaby, Coquitlam, Maple Ridge, New Westminster, North Vancouver, Pitt Meadows, Port Coquitlam, Port Moody, Richmond, South Delta, Squamish, Sunshine Coast, Vancouver, West Vancouver, and Whistler.
src: https://www.rebgv.org/market-watch/monthly-market-report/september-2022.html

Metro Vancouver’s housing market is experiencing a quieter summer season marked by reduced sale and listing activity.
The Real Estate Board of Greater Vancouver (REBGV) reports that residential home sales in the region totalled 1,870 in August 2022, a 40.7 per cent decrease from the 3,152 sales recorded in August 2021, and a 0.9 per cent decrease from the 1,887 homes sold in July 2022.
Last month’s sales were 29.2 per cent below the 10-year August sales average.
"With inflationary pressure and interest rates on the rise, home buyer and seller activity shifted below our long-term seasonal averages this summer. This shift in market conditions caused prices to edge down over the past four months."Andrew Lis, REBGV Director, economics and data analytics
There were 3,328 detached, attached and apartment properties newly listed for sale on the Multiple Listing Service® (MLS®) in Metro Vancouver in August 2022. This represents a 17.5 per cent decrease compared to the 4,032 homes listed in August 2021 and a 16 per cent decrease compared to July 2022 when 3,960 homes were listed.
The total number of homes currently listed for sale on the MLS® system in Metro Vancouver is 9,662, a 7.3 per cent increase compared to August 2021 (9,005) and a 6.1 per cent decrease compared to July 2022 (10,288).
“Home buyers and sellers are taking more time to assess what this changing landscape means for their housing needs,” Lis said. “Preparation is critical in today’s market. Work with your Realtor to assess what today’s home prices, financing options, and other considerations mean for you.”
For all property types, the sales-to-active listings ratio for August 2022 is 19.4 per cent. By property type, the ratio is 12.2 per cent for detached homes, 25.3 per cent for townhomes, and 24.8 per cent for apartments.

Generally, analysts say downward pressure on home prices occurs when the ratio dips below 12 per cent for a sustained period, while home prices often experience upward pressure when it surpasses 20 per cent over several months.
The MLS® Home Price Index composite benchmark price for all residential properties in Metro Vancouver is currently $1,180,500. This represents a 7.4 per cent increase over August 2021 and a 2.2 per cent decrease compared to July 2022.
Sales of detached homes in August 2022 reached 517, a 45.3 per cent decrease from the 945 detached sales recorded in August 2021. The benchmark price for a detached home is $1,954,100. This represents a 7.9 per cent increase from August 2021 and a 2.3 per cent decrease compared to July 2022.
Sales of apartment homes reached 998 in August 2022, a 38.8 per cent decrease compared to the 1,631 sales in August 2021. The benchmark price of an apartment home is $740,100. This represents an 8.7 per cent increase from August 2021 and a two per cent decrease compared to July 2022.
Attached home sales in August 2022 totalled 355, a 38.4 per cent decrease compared to the 576 sales in August 2021. The benchmark price of an attached home is $1,069,100. This represents a 12.7 per cent increase from August 2021 and a 2.5 per cent decrease compared to July 2022.
src: https://www.rebgv.org/market-watch/monthly-market-report/august-2022.html
Home buyer demand continues to ease across Metro Vancouver
Metro Vancouver’s housing market has entered a new cycle marked by quieter home buyer demand and a gradual rise in the supply of homes for sale.
The Real Estate Board of Greater Vancouver (REBGV) reports that residential home sales in the region totalled 1,887 in July 2022, a 43.3 per cent decrease from the 3,326 sales recorded in July 2021, and a 22.8 per cent decrease from the 2,444 homes sold in June 2022.
Last month’s sales were 35.2 per cent below the 10-year July sales average.
Read the full report on the REBGV website!
These infographics cover current trends in North Vancouver, West Vancouver, Vancouver East, and Vancouver West. Click on the images for a larger view!
Download Printable Version – REBGV July 2022 Data Infographic Report North Vancouver
Download Printable Version – REBGV July 2022 Data Infographics Report West Vancouver
Download Printable Version – REBGV July 2022 Data Infographics Report Vancouver West
Download Printable Version – REBGV July 2022 Data Infographics Report Vancouver East


Custom real estate infographics published by myRealPage.com
Monday, August 8, 2022 6:05:03 PM UTC
Home listings up, sales down and prices starting to decrease
With interest rates and housing supply increasing, Metro Vancouver* home buyers are operating in a changing marketplace to begin the summer season.
The Real Estate Board of Greater Vancouver (REBGV) reports that residential home sales in the region totalled 2,444 in June 2022, a 35 per cent decrease from the 3,762 sales recorded in June 2021, and a 16.2 per cent decrease from the 2,918 homes sold in May 2022.
Last month’s sales were 23.3 per cent below the 10-year June sales average.
Read the full report on the REBGV website!
These infographics cover current trends in North Vancouver, West Vancouver, Vancouver East, and Vancouver West. Click on the images for a larger view!
Download Printable Version – REBGV June 2022 Data Infographic Report North Vancouver
Download Printable Version – REBGV June 2022 Data Infographics Report West Vancouver
Download Printable Version – REBGV June 2022 Data Infographics Report Vancouver West
Download Printable Version – REBGV June 2022 Data Infographics Report Vancouver East


Custom real estate infographics published by myRealPage.com
Friday, July 8, 2022 10:56:04 PM UTC
Spring ushers in calmer housing market trends in Metro Vancouver
“With interest rates rising, home buyers are taking more time to make their decisions in today’s housing market. Home buyers have been operating in a frenzied environment for much of the past two years. This spring is providing a calmer environment, with fewer multiple offer situations, which is allowing buyers to explore their housing options, understand the changing mortgage market, and do their due diligence.” said Daniel John, chairman of the REBGV.
“Upward pressure on home prices has begun to ease in the housing market over the last two months,” John said. “Where home prices go next will depend on housing supply. While we’re beginning to see modest increases in home listings, we still need housing supply totals to more than double to bring the market close to balanced territory.”
Read the full report on the REBGV website!
These infographics cover current trends in North Vancouver, West Vancouver, Vancouver East, and Vancouver West. Click on the images for a larger view!
Download Printable Version – REBGV May 2022 Data Infographic Report North Vancouver
Download Printable Version – REBGV May 2022 Data Infographics Report West Vancouver
Download Printable Version – REBGV May 2022 Data Infographics Report Vancouver West
Download Printable Version – REBGV May 2022 Data Infographics Report Vancouver East


Custom real estate infographics published by myRealPage.com
Monday, June 6, 2022 8:58:28 PM UTC
Metro Vancouver home sales return to more traditional levels in April
Home buyer demand in Metro Vancouver* returned to more historically typical levels in April.
The Real Estate Board of Greater Vancouver (REBGV) reports that residential home sales in the region totalled 3,232 in April 2022, a 34.1 per cent decrease from the 4,908 sales recorded in April 2021, and a 25.6 per cent decrease from the 4,344 homes sold in March 2022.
Last month’s sales were 1.5 per cent above the 10-year April sales average.
“So far this spring, we’ve seen home sales ease down from the record-breaking pace of the last year,” Daniel John, REBGV Chair said. “While a small sample size, the return to a more traditional pace of home sales that we’ve experienced over the last two months provides hopeful home buyers more time to make decisions, secure financing and perform other due diligence such as home inspections.”
There were 6,107 detached, attached and apartment properties newly listed for sale on the Multiple Listing Service® (MLS®) in Metro Vancouver in April 2022. This represents a 23.1 per cent decrease compared to the 7,938 homes listed in April 2021 and an 8.5 per cent decrease compared to March 2022 when 6,673 homes were listed.
Read the full report on the REBGV website!
These infographics cover current trends in North Vancouver, West Vancouver, Vancouver East, and Vancouver West. Click on the images for a larger view!
Download Printable Version – REBGV April 2022 Data Infographic Report North Vancouver
Download Printable Version – REBGV April 2022 Data Infographics Report West Vancouver
Download Printable Version – REBGV April 2022 Data Infographics Report Vancouver West
Download Printable Version – REBGV April 2022 Data Infographics Report Vancouver East


Custom real estate infographics published by myRealPage.com
Friday, May 6, 2022 3:18:02 PM UTC
Home buyer demand remains elevated across Metro Vancouver
While down from last year’s record numbers, home sale activity in Metro Vancouver’s* housing market remained elevated in March.
The Real Estate Board of Greater Vancouver (REBGV) reports that residential home sales in the region totalled 4,344 in March 2022, a 23.9 per cent decrease from the 5,708 sales recorded in March 2021, and a 26.9 per cent increase from the 3,424 homes sold in February 2022.
Last month’s sales were 25.5 per cent above the 10-year March sales average.
Read the full report on the REBGV website!
These infographics cover current trends in North Vancouver, West Vancouver, Vancouver East, and Vancouver West. Click on the images for a larger view!
Download Printable Version – REBGV March 2022 Data Infographic Report North Vancouver
Download Printable Version – REBGV March 2022 Data Infographics Report West Vancouver
Download Printable Version – REBGV March 2022 Data Infographics Report Vancouver West
Download Printable Version – REBGV March 2022 Data Infographics Report Vancouver East


Custom real estate infographics published by myRealPage.com
Thursday, April 7, 2022 6:16:42 PM UTC
Listings inch up, demand remains steady and price gains continue
The Metro Vancouver housing market saw steady home sales activity, modest increases in home listings and continued upward trends in pricing in February.
The Real Estate Board of Greater Vancouver (REBGV) reports that residential home sales in the region totalled 3,424 in February 2022, an 8.1 per cent decrease from the 3,727 sales recorded in February 2021, and a 49.8 per cent increase from the 2,285 homes sold in January 2022.
Last month’s sales were 26.9 per cent above the 10-year February sales average.
Read the full report on the REBGV website!
These infographics cover current trends in North Vancouver, West Vancouver, Vancouver East, and Vancouver West. Click on the images for a larger view!
Download Printable Version – REBGV February 2022 Data Infographic Report North Vancouver
Download Printable Version – REBGV February 2022 Data Infographics Report West Vancouver
Download Printable Version – REBGV February 2022 Data Infographics Report Vancouver West
Download Printable Version – REBGV February 2022 Data Infographics Report Vancouver East


Custom real estate infographics published by myRealPage.com
Monday, March 7, 2022 9:46:45 PM UTC
Low supply keeps upward pressure on home prices across Metro Vancouver
The first month of 2022 saw home sales come down from last year’s record-setting pace, while low supply continued to cause home prices to edge higher across Metro Vancouver*.
The Real Estate Board of Greater Vancouver (REBGV) reports that residential home sales in the region totalled 2,285 in January 2022, a 4.4 per cent decrease from the 2,389 sales recorded in January 2021, and a 15 per cent decrease from the 2,688 homes sold in December 2021.
Last month’s sales were 25.3 per cent above the 10-year January sales average.
Read the full report on the REBGV website!
These infographics cover current trends in North Vancouver, West Vancouver, Vancouver East, and Vancouver West. Click on the images for a larger view!
Download Printable Version – REBGV January 2022 Data Infographic Report North Vancouver
Download Printable Version – REBGV January 2022 Data Infographics Report West Vancouver
Download Printable Version – REBGV January 2022 Data Infographics Report Vancouver West
Download Printable Version – REBGV January 2022 Data Infographics Report Vancouver East


Custom real estate infographics published by myRealPage.com
Monday, February 7, 2022 4:01:56 PM UTC
Metro Vancouver home sales set a record in 2021
Metro Vancouver* home sales reached an all-time high in 2021 as housing needs remained a top priority for residents in the second year of the COVID-19 pandemic.
The Real Estate Board of Greater Vancouver (REBGV) reports that residential home sales in the region totalled 43,999 in 2021, a 42.2 per cent increase from the 30,944 sales recorded in 2020, a 73.6 per cent increase from the 25,351 homes sold in 2019, and a four per cent increase over the previous all-time sales record of 42,326 set in 2015.
Last year’s sales total was 33.4 per cent above the 10-year sales average.
Read the full report on the REBGV website!
These infographics cover current trends in North Vancouver, West Vancouver, Vancouver East, and Vancouver West. Click on the images for a larger view!
Download Printable Version – REBGV December 2021 Data Infographic Report 1
Download Printable Version – REBGV December 2021 Data Infographics Report 2
Download Printable Version – REBGV December 2021 Data Infographics Report 3
Download Printable Version – REBGV December 2021 Data Infographics Report 4


Custom real estate infographics published by myRealPage.com
Tuesday, January 11, 2022 10:17:06 PM UTC
Home sales activity remains up, listings down across Metro Vancouver’s housing market
As we near the end of 2021, home buyer demand remains well in excess of long-term averages and the supply of homes for sale continues to decline across Metro Vancouver’s* housing market
.The Real Estate Board of Greater Vancouver (REBGV) reports that residential home sales in the region totalled 3,428 in November 2021, an 11.9 per cent increase from the 3,064 sales recorded in November 2020, and a 1.9 per cent decrease from the 3,494 homes sold in October 2021.
Last month’s sales were 33.6 per cent above the 10-year November sales average.
Read the full report on the REBGV website!
These infographics cover current trends in North Vancouver, West Vancouver, Vancouver East, and Vancouver West. Click on the images for a larger view!
Download Printable Version – REBGV November 2021 Data Infographic Report 1
Download Printable Version – REBGV November 2021 Data Infographics Report 2
Download Printable Version – REBGV November 2021 Data Infographics Report 3
Download Printable Version – REBGV November 2021 Data Infographics Report 4


Custom real estate infographics published by myRealPage.com
Tuesday, December 7, 2021 10:41:03 PM UTC
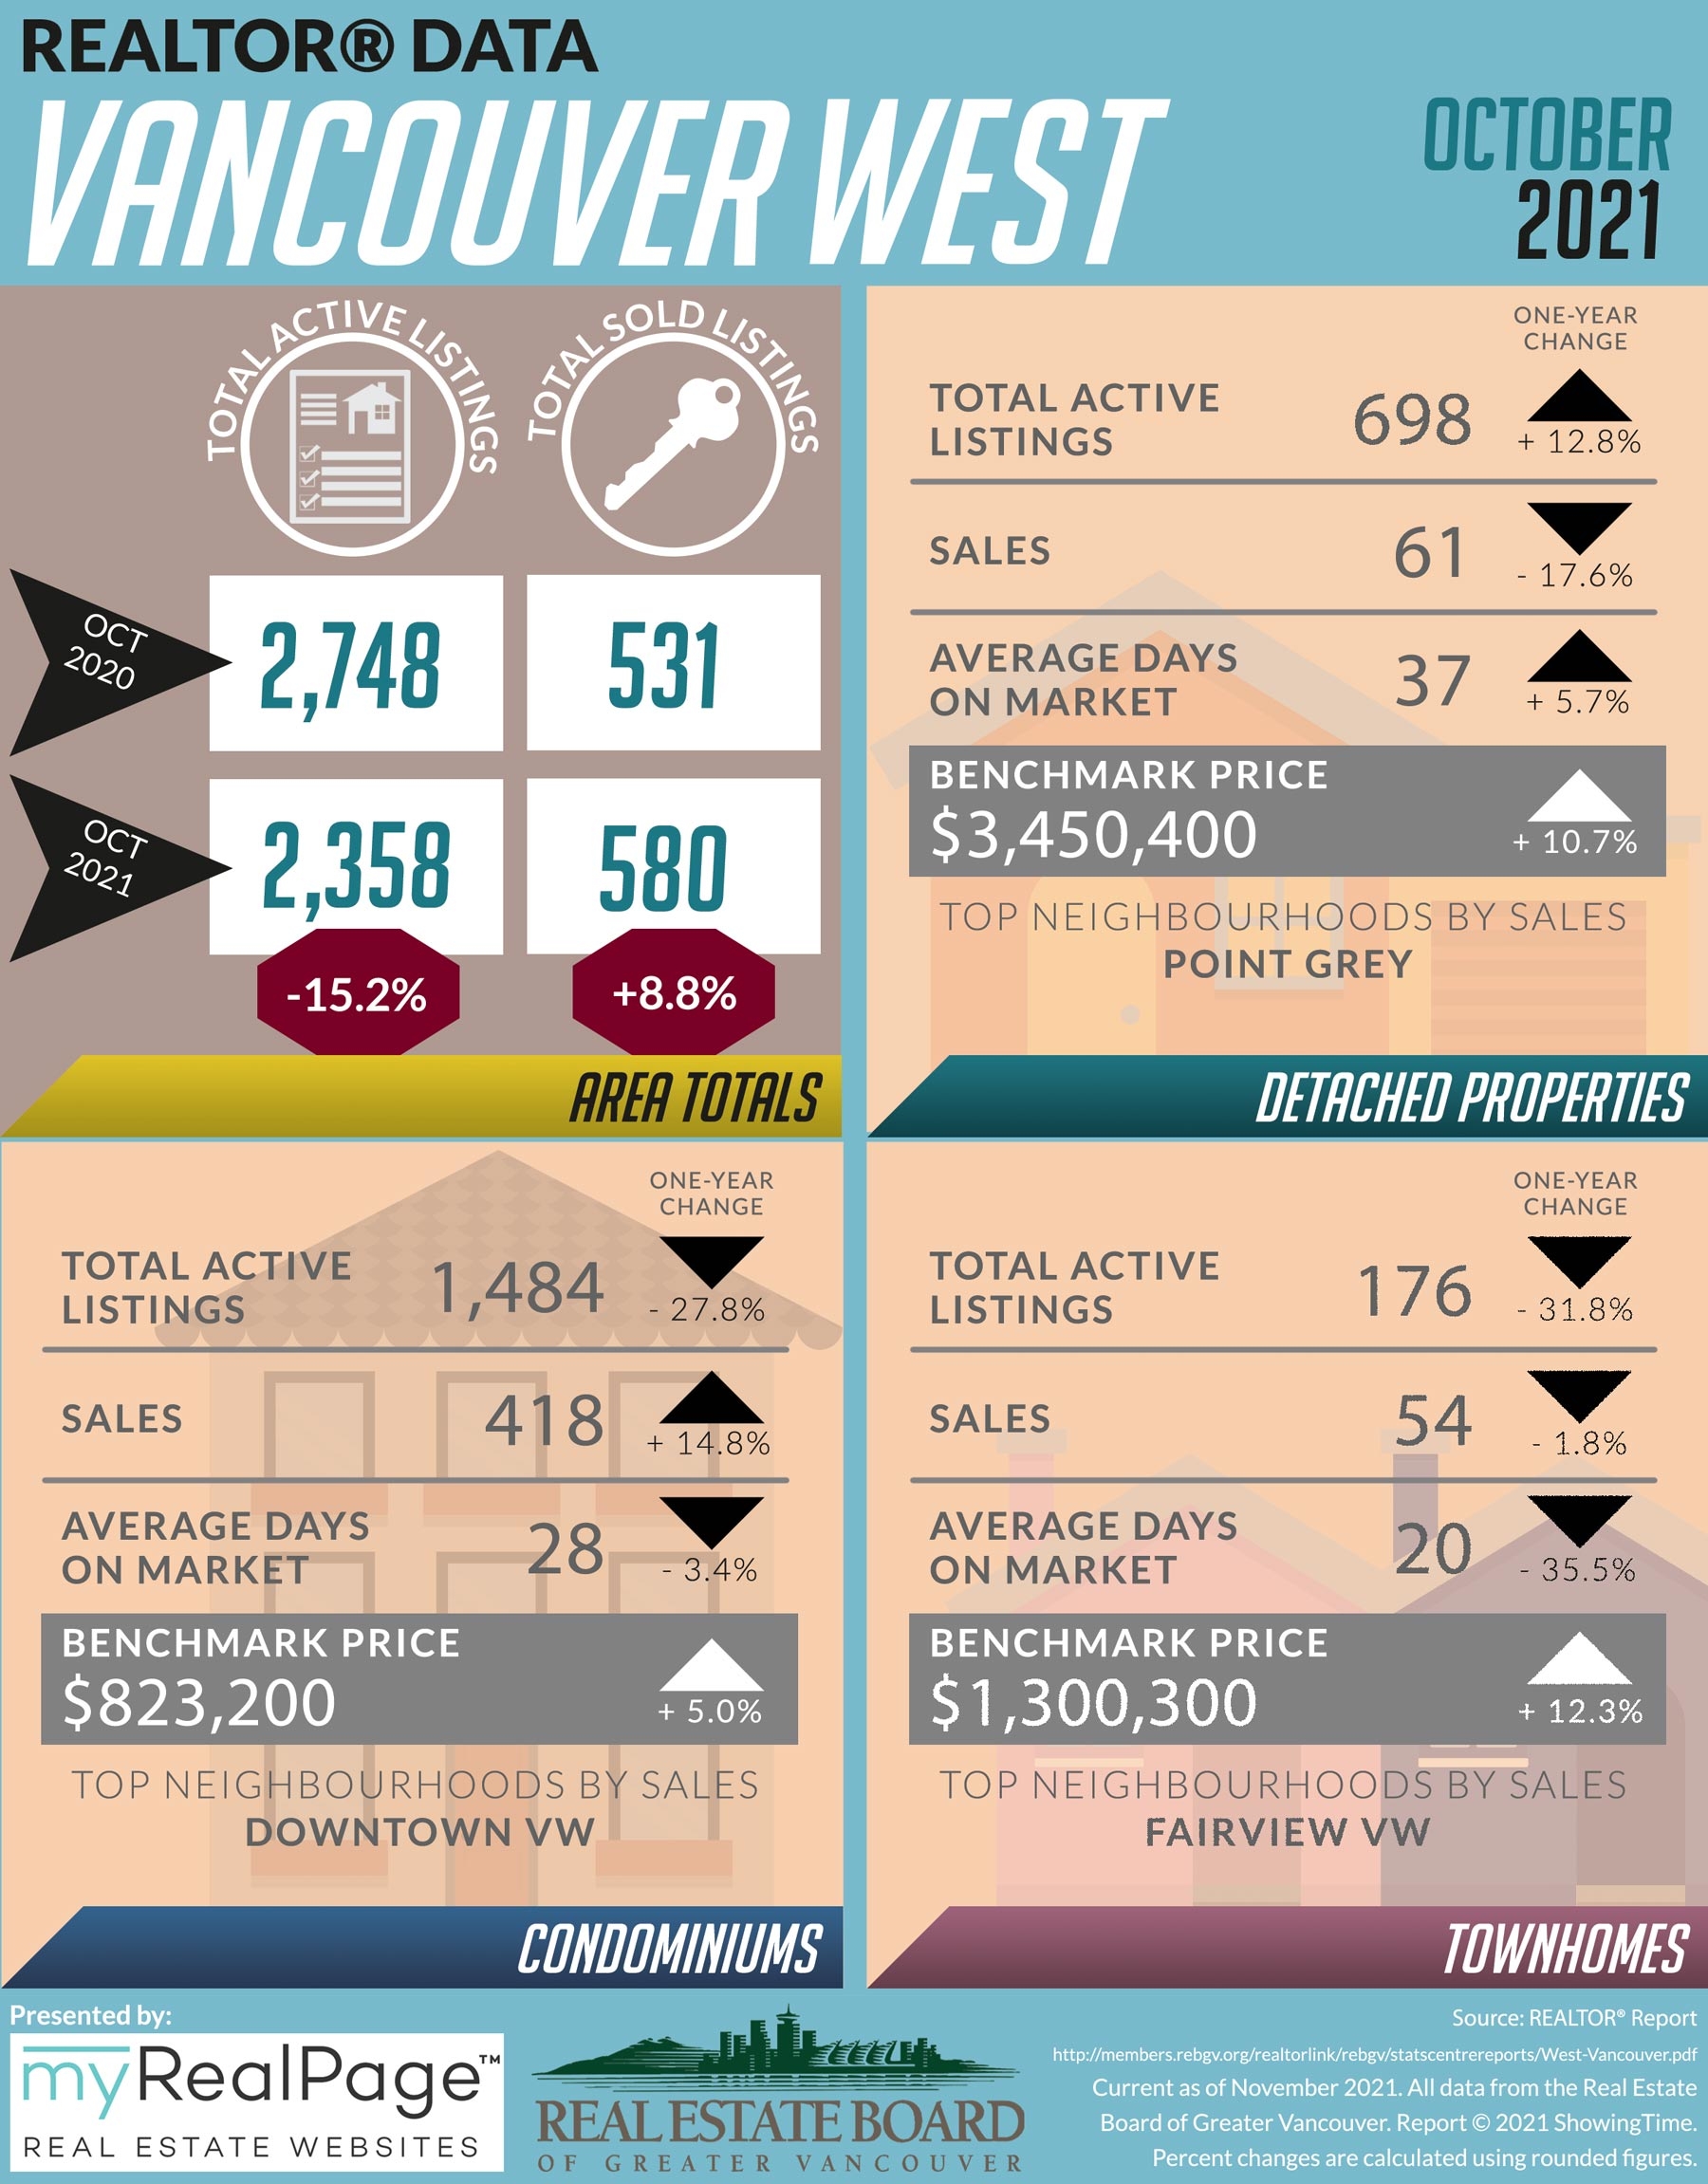
Metro Vancouver home buyers compete for fewer home listings in October
Home sale activity in Metro Vancouver* remained above historical averages in October while the overall supply of homes for sale dipped to levels not seen in three years.
The Real Estate Board of Greater Vancouver (REBGV) reports that residential home sales in the region totalled 3,494 in October 2021, a 5.2 per cent decrease from the 3,687 sales recorded in October 2020, and an 11 per cent increase from the 3,149 homes sold in September 2021.
Last month’s sales were 22.4 per cent above the 10-year October sales average.
Read the full report on the REBGV website!
These infographics cover current trends in North Vancouver, West Vancouver, Vancouver East, and Vancouver West. Click on the images for a larger view!
Download Printable Version – REBGV October 2021 Data Infographic Report 1
Download Printable Version – REBGV October 2021 Data Infographics Report 2
Download Printable Version – REBGV October 2021 Data Infographics Report 3
Download Printable Version – REBGV October 2021 Data Infographics Report 4


Custom real estate infographics published by myRealPage.com
Friday, November 5, 2021 10:58:32 PM UTC