Metro Vancouver home buyers compete for fewer home listings in October
Home sale activity in Metro Vancouver* remained above historical averages in October while the overall supply of homes for sale dipped to levels not seen in three years.
The Real Estate Board of Greater Vancouver (REBGV) reports that residential home sales in the region totalled 3,494 in October 2021, a 5.2 per cent decrease from the 3,687 sales recorded in October 2020, and an 11 per cent increase from the 3,149 homes sold in September 2021.
Last month’s sales were 22.4 per cent above the 10-year October sales average.
Read the full report on the REBGV website!
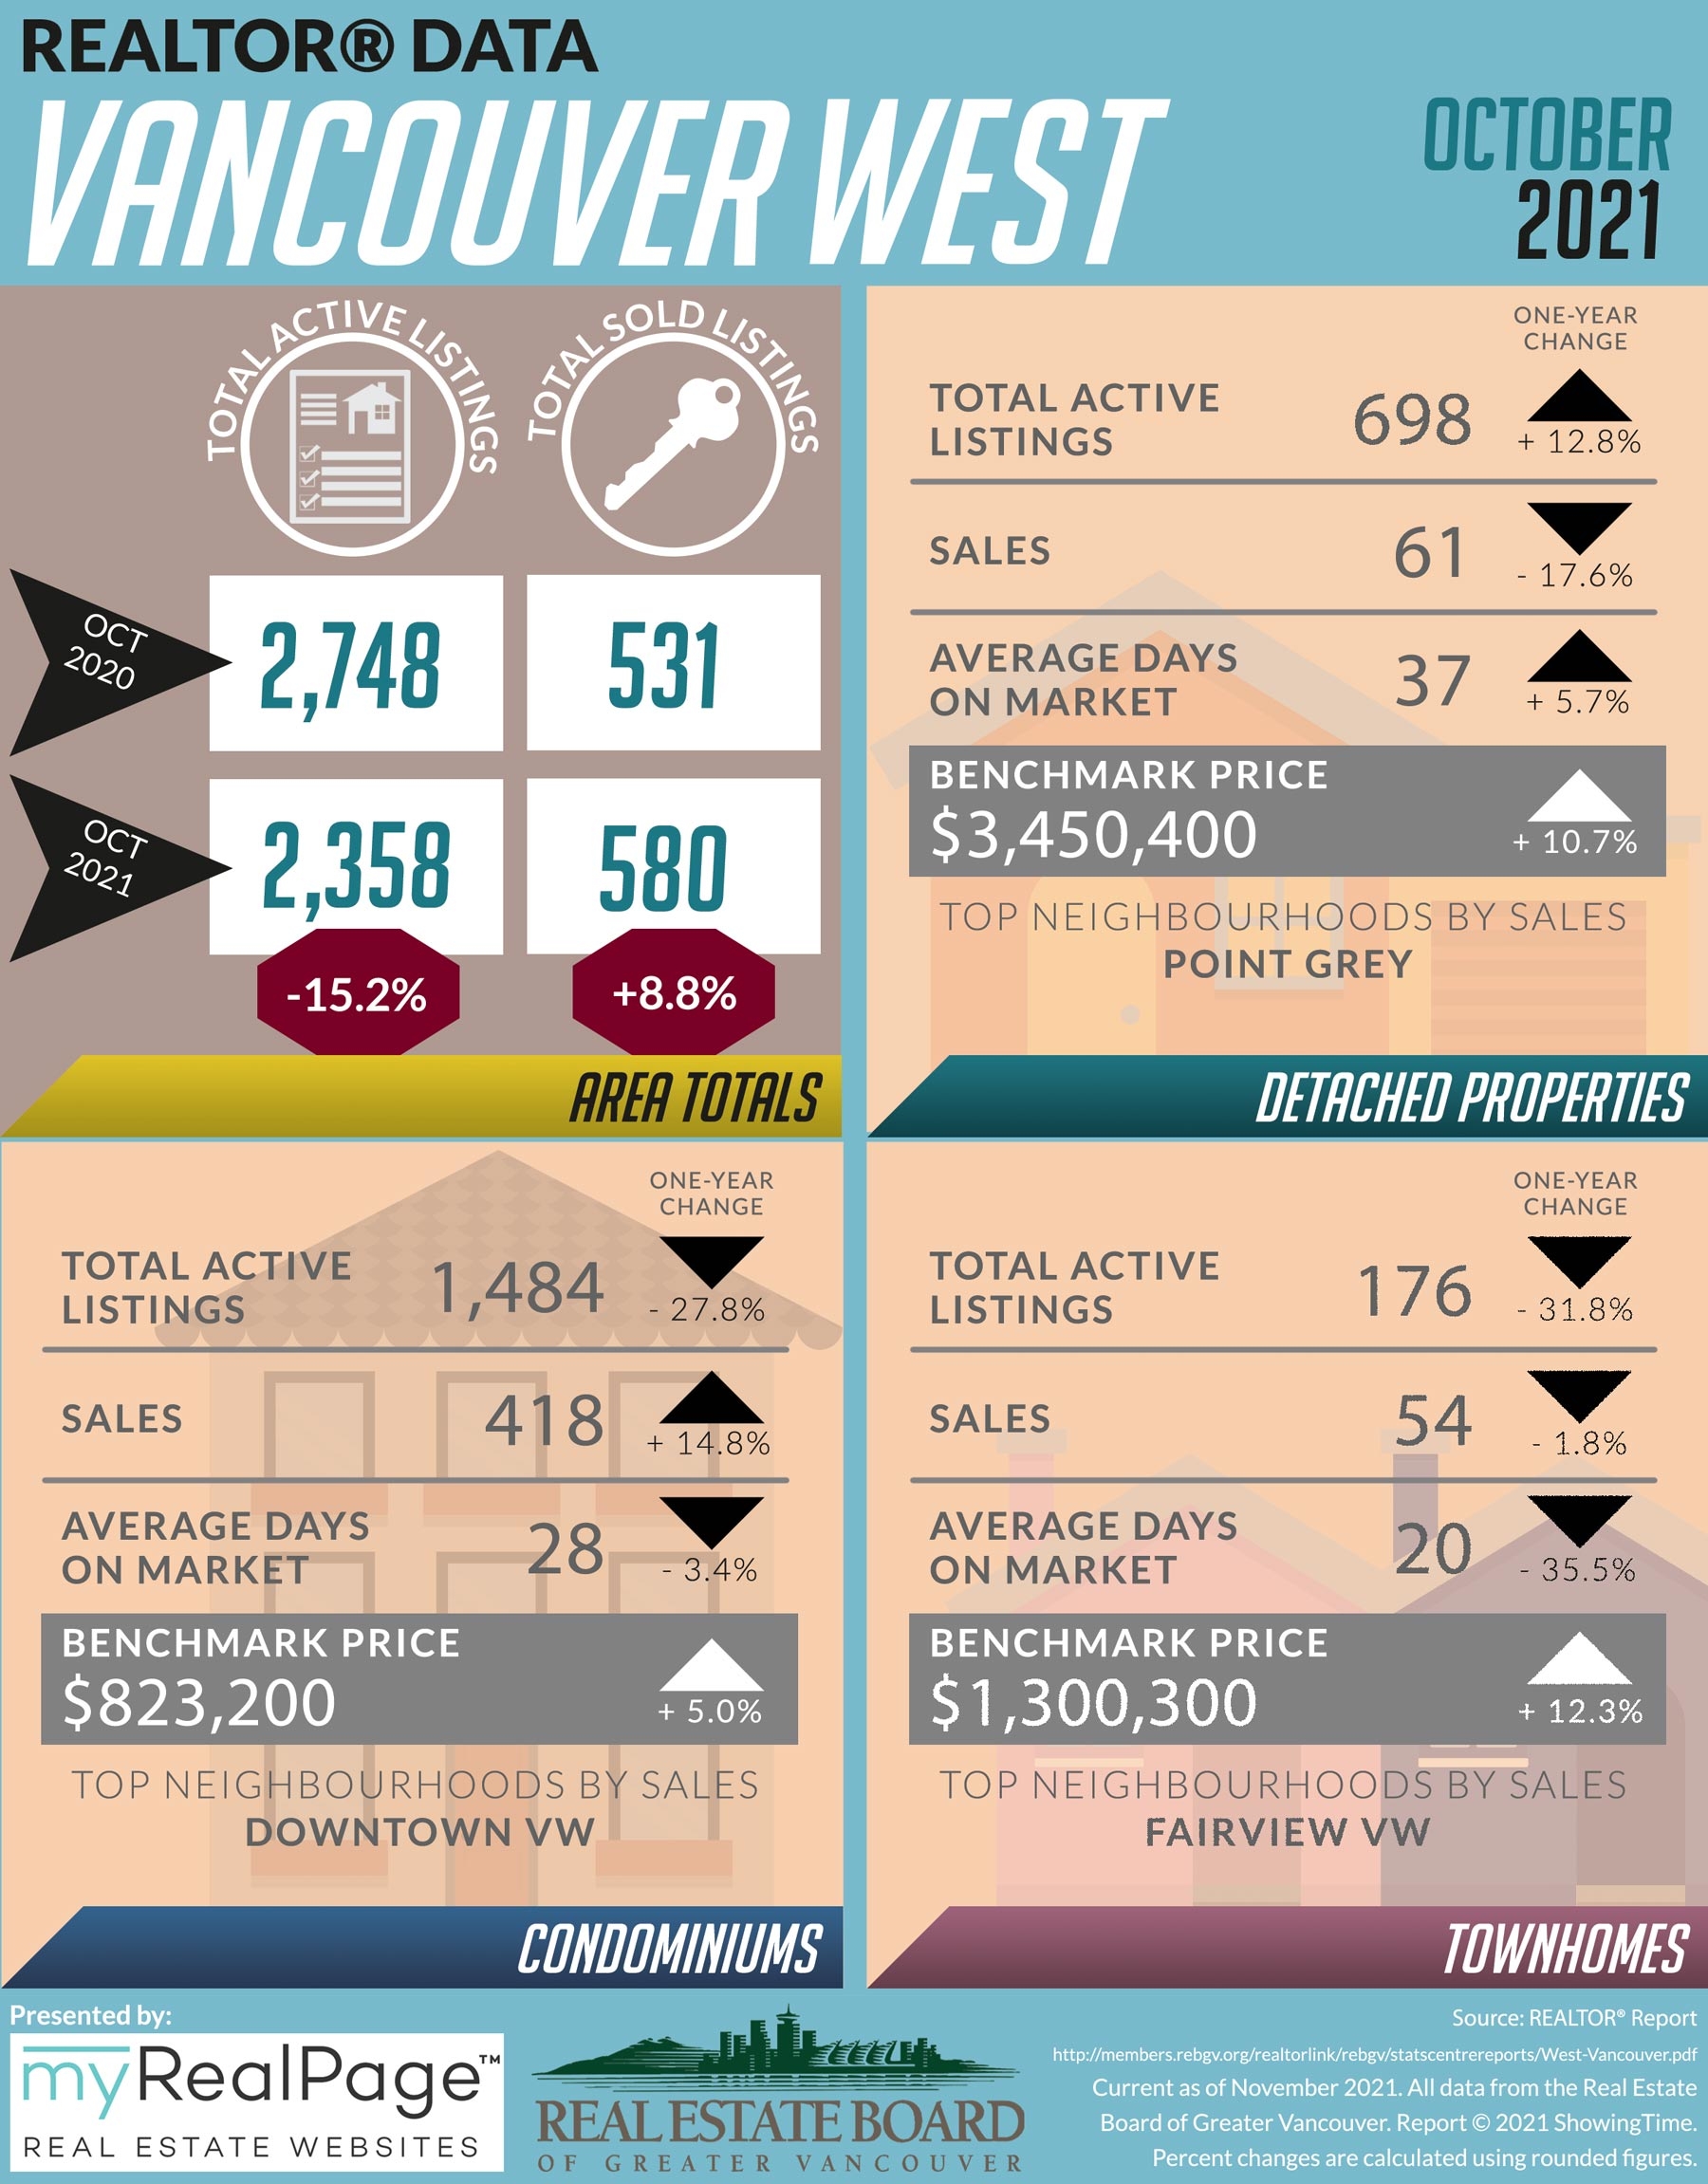
These infographics cover current trends in North Vancouver, West Vancouver, Vancouver East, and Vancouver West. Click on the images for a larger view!
Download Printable Version – REBGV October 2021 Data Infographic Report 1
Download Printable Version – REBGV October 2021 Data Infographics Report 2
Download Printable Version – REBGV October 2021 Data Infographics Report 3
Download Printable Version – REBGV October 2021 Data Infographics Report 4


Custom real estate infographics published by myRealPage.com

